Travel Summary Report (Desktop)
The purpose of the Travel Summary report is to allow you to review a summary of all activities that occurred for an asset in a specific timeframe from a management perspective, enabling you to verify performance and identify areas for reducing costs when you see patterns of prolonged periods of idling or other inactivity.
The Travel Summary Report pulls data points from Trips to provide a summary view and is useful for identifying outliers in large fleets.
💥 Travel Summary Report is part of the Asset Activity premium product and requires a separate license. Please contact your Account Manager for more information on premium product licenses or reach out to Customer Support at help@tenna.com or call 888.836.6269.
Note: Average idle time is inferred by Tenna based on the cumulative idle hours received from AEMP and what is captured by Tenna trackers.
Trackers: Owned or rental assets with a category type of Equipment, Vehicle or Truck will pull into this report for the time period selected, provided the tracker is installed, verified and online.
- Typical trackers for these assets include plug-in trackers, like TennaCANbus, TennaFLEET, TennaMINI Plug-Ins, and TennaINTEL P1. TennaIN AEMP assets will also populate in this report.
- If an asset has no data as a result of its tracker being offline during the selected time frame, it may not appear in the report.
Note: TennaMINI devices (Plug-In, Plug-In Solar and 2.0) devices only capture ignition ON and OFF states and cannot determine when an engine is actively running vs. idling. TennaCANbus and TennaFLEET II trackers allow this.
This report is based on cumulative statistics and is not trip-based, and therefore AEMP assets are included by default. AEMP assets do not report Trips or a breadcrumb trail, but Tenna receives and reports their cumulative information.
Data from the Travel Summary report is paginated and can be exported as “All Results” or “Only Displayed” (i.e., only displayed on that page). Each page displays trips for 100 assets. The default display is sorted by the Fleet No. column in ascending order.
Pro Tip! Quick filters in this report include category types. The save filters functionality is available in this report so you can save a preferred filter as a new report. For example, you can create a “My Report” for Dump Truck Travel Summary by narrowing down the list to just dump trucks and saving the report to return to this view regularly.
Permission Requirements: Users will need all of the following five permissions turned ON to view this report: Asset Miles, Hours, Location History, Trips, Fuel Report & Details.
Note: If Data Access Controls is enabled on your account, users will only see the assets to which they have access when viewing this report.
In this article:
Sample Report - Overview of Travel Summary Report Fields
Sample Report - Overview of Travel Summary Report Fields

- Fleet Number: Asset identifier. This entry is a hyperlink to the Asset’s Details. Hovering over the link will show a popover with the asset’s image (if there is one). The eye icon on this popover will also take you to the Asset’s Details.
- Asset Name: Asset identifier. This entry is a hyperlink to the Asset’s Details. Hovering over the link will show a popover with the asset’s image (if there is one). The eye icon on this popover will also take you to the Asset’s Details.
- The Asset Details column group is collapsed by default. If expanded, additional columns will be shown for Status, Current Site, Designation, Year, Make, Model, and Current Assignee.

- Major Category: Assets categorized as Equipment, Truck or Vehicle will pull into the Travel Summary Report if their tracker is online and they had activity during the time period the report is run for.
- The Asset Category column group is collapsed by default. If expanded, columns will be shown for Subcategory 1, Subcategory 2 and Subcategory 3.
- Org Sublevel 1: The highest level of the org chart the asset is organized within.
- The Organization column group is collapsed by default. If expanded, columns will be shown for Org Sublevel 2 and Org Sublevel 3.
- Trips/Cycles: Count of trips/cycles completed during the selected time period. The row will show the count for that specific asset.
Note: By default, assets will only pull into this report if they had completed and processed trips or cycles for the time period selected. If an asset is missing from the report, it did not have trip or cycle activity during this time frame. To show assets without Trips/Cycles, select the gear icon on the right side of the report to open Settings. Select the toggle to turn off “Show Only Assets with Trips/Cycles”.
- Stops: The total number of stop events during the selected time period.
Note: Stop Event Thresholds must be configured prior to this field and the Starts and Stops Report to generate.
- Stop Time: The total duration of stop events during the selected time period.
Note: The Stops and Stop Time fields will only populate if the Starts and Stops Premium Reports are enabled (part of the Asset Activity license).
- Miles: Cumulative miles logged against the asset across the number of trips recorded for the report’s selected date range.
- Hours: Cumulative hours logged against the asset across the number of cycles recorded for the report’s selected date range.
- Trip Duration: Cumulative duration (hh:mm:ss) of trips for that date range.
NOTE: TennaIN AEMP assets do not report Trips or a breadcrumb trail, but Tenna receives and reports their cumulative information.
- Idle Time: Values in this column capture the sum of all idle time from the total trip duration for all trips per asset within the selected date range, shown in hours:minutes:seconds.
- For vehicles that support idling identification, they will report idling in this column by TennaFLEET OBD II, TennaFLEET JBUS, TennaFLEET II, TennaCAM and TennaCAM 2.0.
Idling is captured as a distinct event and the duration per trip is shown in this column. Idling is reported when the engine is on (ignition: ON) and the vehicle is moving at less than 5 mph for a period of 3-5 minutes, depending on the model of your fleet tracker. Tenna fleet trackers have timers that record and report when an asset is running and is not moving.
Note: Idling time duration excludes times when the OEM-installed Power Takeoff (PTO) is engaged, in most cases. TennaFLEET II Trackers, TennaCAM 2.0 and TennaCANbus can detect if OEM PTO is engaged for a vehicle so that even if its not moving, we will not capture idle time.
Equipment idling displayed in this report will be from AEMP assets if available from the manufacturer (Caterpillar, John Deere, Komatsu, Volvo, United Rentals).
- % Idle: The percentage of time the asset has reported idling based out of total Trip Duration. (Idle Time / Trip Duration) x 100 = % Idle
- For example: 25% Idle means that the vehicle idled and average of 25 minutes out of every 100 minutes.
Pro Tip! This report is intended to show a summary over time. Sort this report by the Idle Time column to find the outliers for which trucks idled or drove the most over the time period selected.
- PTO: Cumulative duration Power Take Off was engaged across the number of trips recorded for the report’s selected date range. If no PTO was engaged, this column will have no value and read “—"
Note: Run Time, Idling, PTO and Stop Time (future) durations are displayed in hours, minutes and seconds (HH:MM:SS) in the Tenna Report. When exporting/exporting all results into Excel, these durations will export as rounded hours only.
Additionally, the subtotal column at the bottom of the report will not be exported into Excel.
- Max Speed: The highest detected GPS speed reported during the report time frame. This is a maximum value, not an average.
- This column contains data that is specifically related to specific Tenna trackers (TennaCANbus and TennaFLEET II)
- This row is not included in exports
- Idle Fuel Consumed: Fuel consumed in an idle state in gallons.
- This column contains data that is specifically related to specific Tenna trackers (TennaCANbus and TennaFLEET II)
- Fuel Consumed: Total fuel consumed (in gallons) across all recorded trips for the report time period.
- % Idle Fuel: Shows percentage of fuel the asset has consumed while idling out of total fuel consumed, if reported by the asset. (Idle Fuel Consumed / Fuel Consumed) x 100 = % Idle Fuel
- For example: 25% Idle Fuel means that 25% of the total fuel consumed was consumed while idling.
- Trip Fuel Economy: This data point is calculated using ECU data points: Trip Distance, Trip Duration and Fuel Consumed.
- Data will be in MPG for vehicles or trucks, and GPH for equipment.
- Trip Fuel Economy will be calculated using eligible data from an asset’s trips
- Eligible MPG Data: Trips with fuel gallons used and distance > 0.
- Eligible GPH Data: Trips with fuel gallons used and duration > 0.
- If Distance or Duration is = 0 or Fuel gallons = 0, the trip data will not be included.
- This column contains data that is specifically related to specific Tenna trackers. (TennaCANbus or TennaFLEET II)
- This field may populate for TennaIN AEMP assets, as well, if the above data points are available.
- Subtotal: The subtotals in this row show the sum of all data points displayed on the page for that column.
- Report Total: The totals in this row show the sum of all data points in the entire report (all pages) for that column.
In the example below, the Subtotal row shows totals for 100 assets (the visible assets on the current page). The Report Total row shows totals for all 119 assets as currently filtered in the report (but not necessarily visible on the current page). See: Showing 1-100 of 119 in bottom right.

Travel Summary Report Settings and Filters
To access the report Settings, select the gear icon on the right side of the screen.
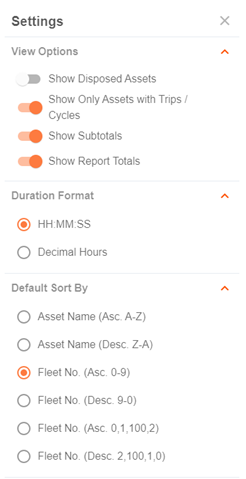
Select the toggles to change your View Options:
- Show Disposed Assets: Shows or hides assets designated as Disposed
- Show Only Assets with Trips/Cycles: Shows or hides assets that have not recorded a Trip or Cycle within the date/time selected.
- Show Subtotals: Shows or hides Subtotal row
- Show Report Totals: Shows or hides Report Total row
Select Duration Format:
- HH:MM:SS
- Decimal Hours (00.00)
Note: This changes the format for columns Trip Duration, Stop Time, Idle Time and PTO
Select how to Sort the report:
- By Asset Name
- By Fleet No
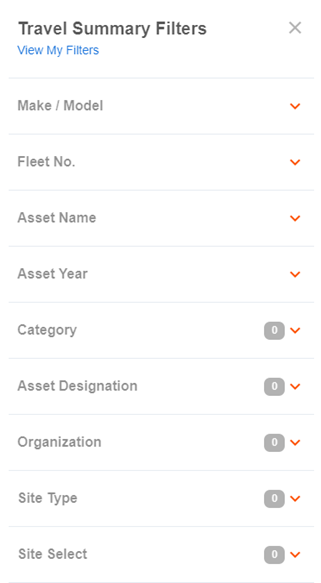
Select the Filter icon on the right side of the report to filter the report to your needs:
Travel Summary FAQ
How are overnight trips factored into this report?
There is currently no indicator of whether a trip spanned for a longer duration than the time period of the report. The report shows a summary of activity for the selected date range. If a completed (and fully processed) trip spanned a greater length of time than the report end date (for example, trip started on Monday evening and ended on Tuesday, but report is run for all day Monday), the report will factor in the proportion of the trip that was run during that time frame.
The best way to identify if only a portion of a trip was factored into the report would be to check the Trips report for all trip details, or the specific trip itself at the asset level.