How to View Site Utilization (Desktop)
Reviewing asset utilization on your sites helps determine whether the assets are truly needed on that site, aiming to reduce the amount of unnecessary equipment costs, as well as identify site hoarding.
Permission Requirements: Any user with the "Site Utilization" permission has access to the Utilization feature, as well as seeing this information via the Utilization tab on Site Details.
Note: Site Utilization grids and reports can only be viewed in Tenna on your desktop. It is not available in the Tenna App.
In this article:
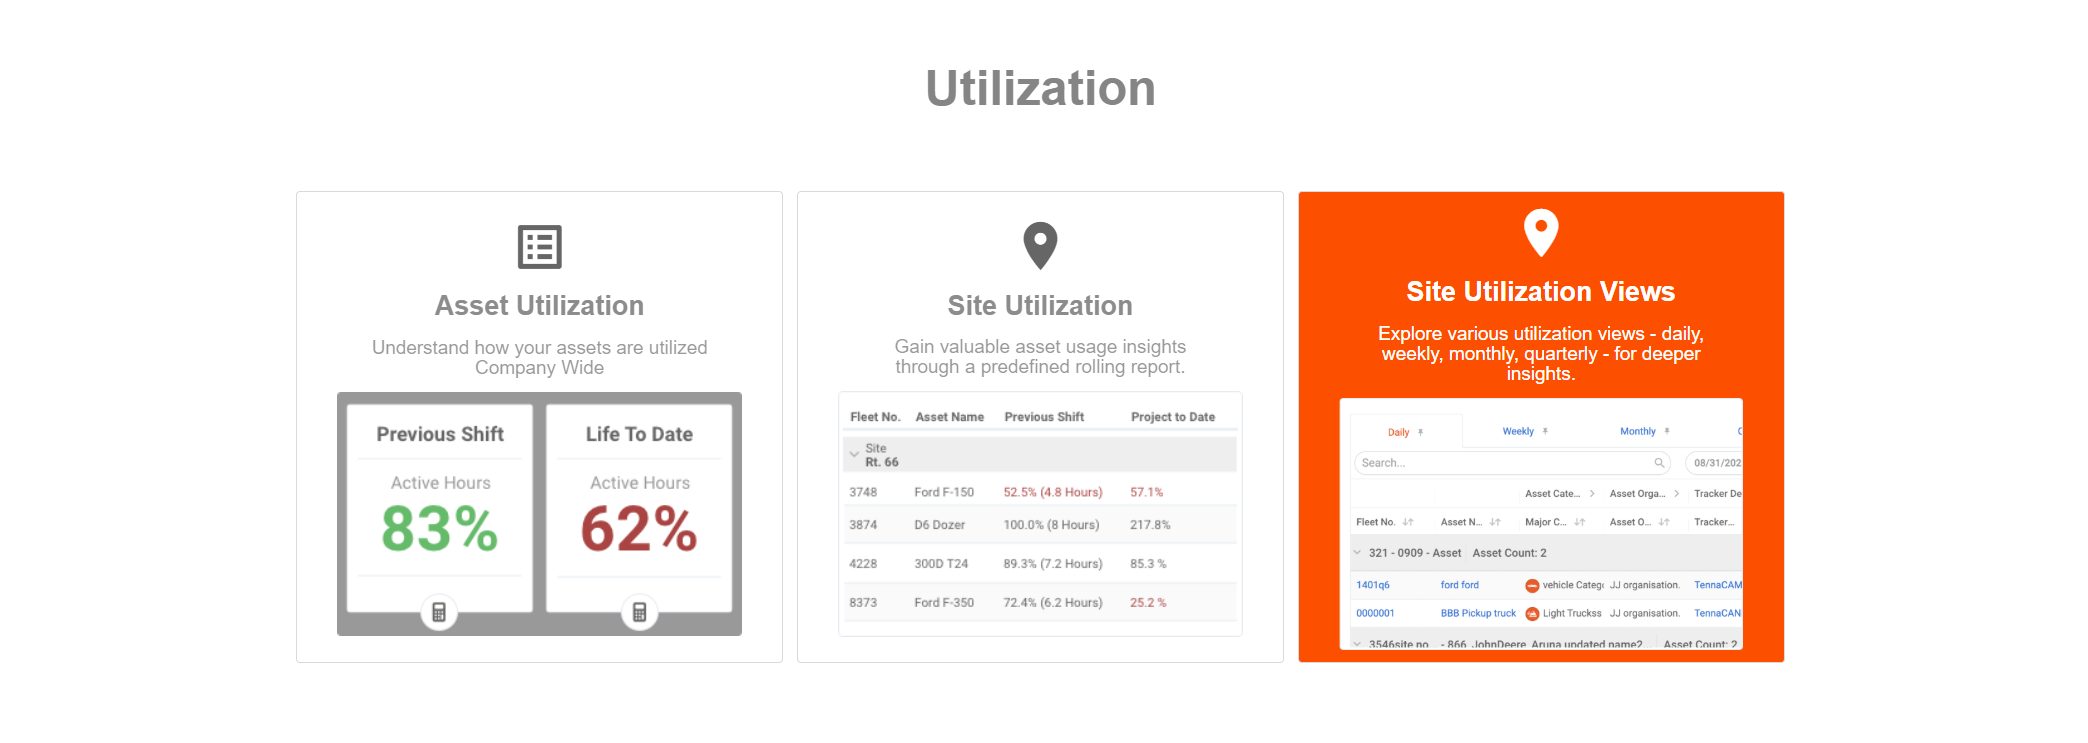
There are three main areas to view site utilization data in Tenna:
- Site Utilization Views Report
- Site Details Utilization
- Site Utilization Grid
How to View Site Utilization Views Report
The Site Utilization Views Report is your true "site rollup" report - meaning it shows utilization data for all assets within the Site's geofence during the defined date/time range. This gives you full visibility into asset utilization by site, and which site is responsible for yield and waste.
- 1
- Click "Utilization" on the left side navigation.

- 2
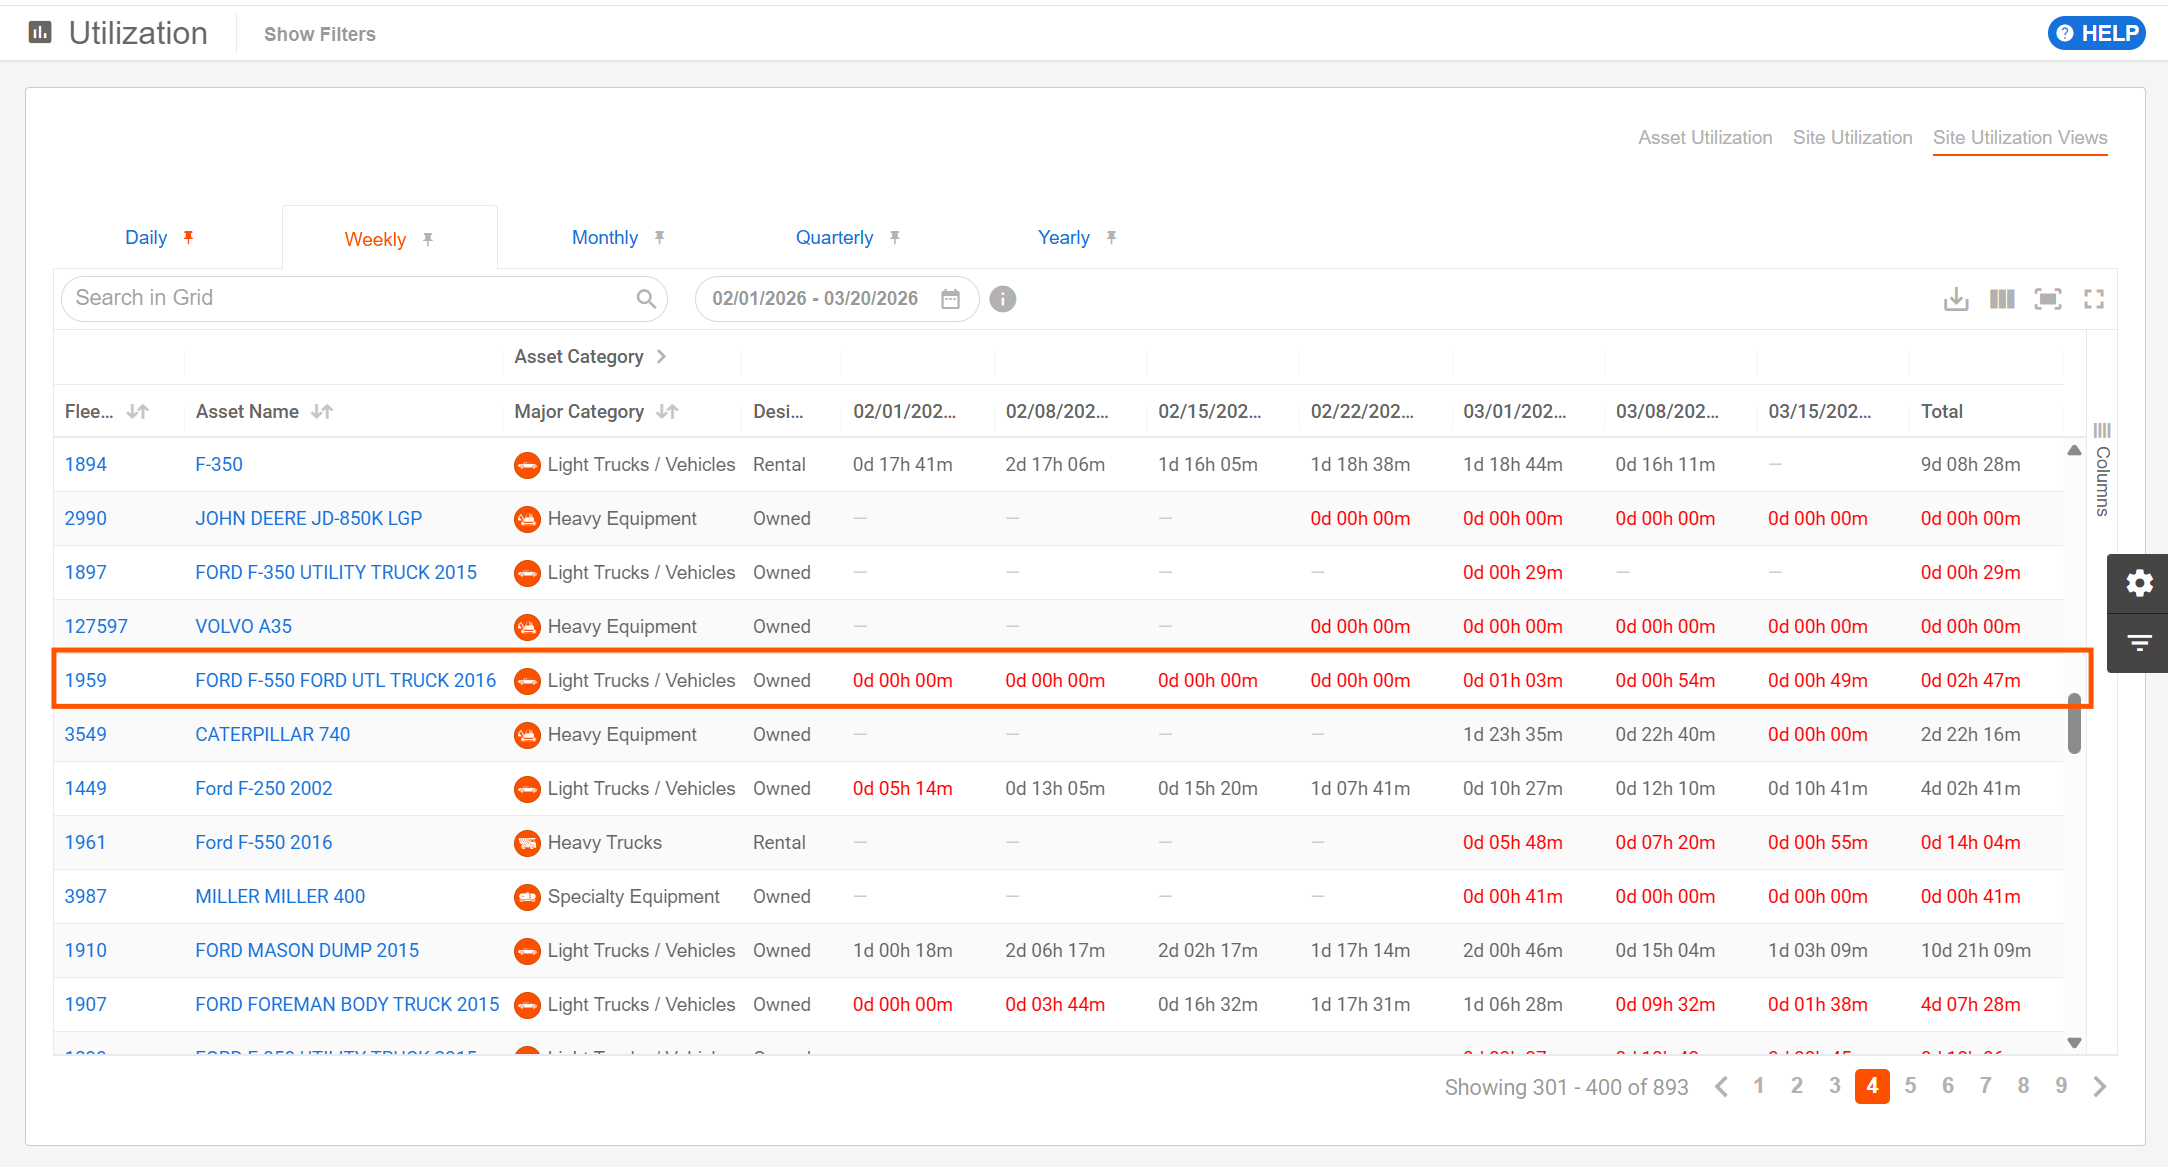
- Select "Site Utilization Views".
- 3
- Utilize the search bar, settings, and filters to navigate the grid.
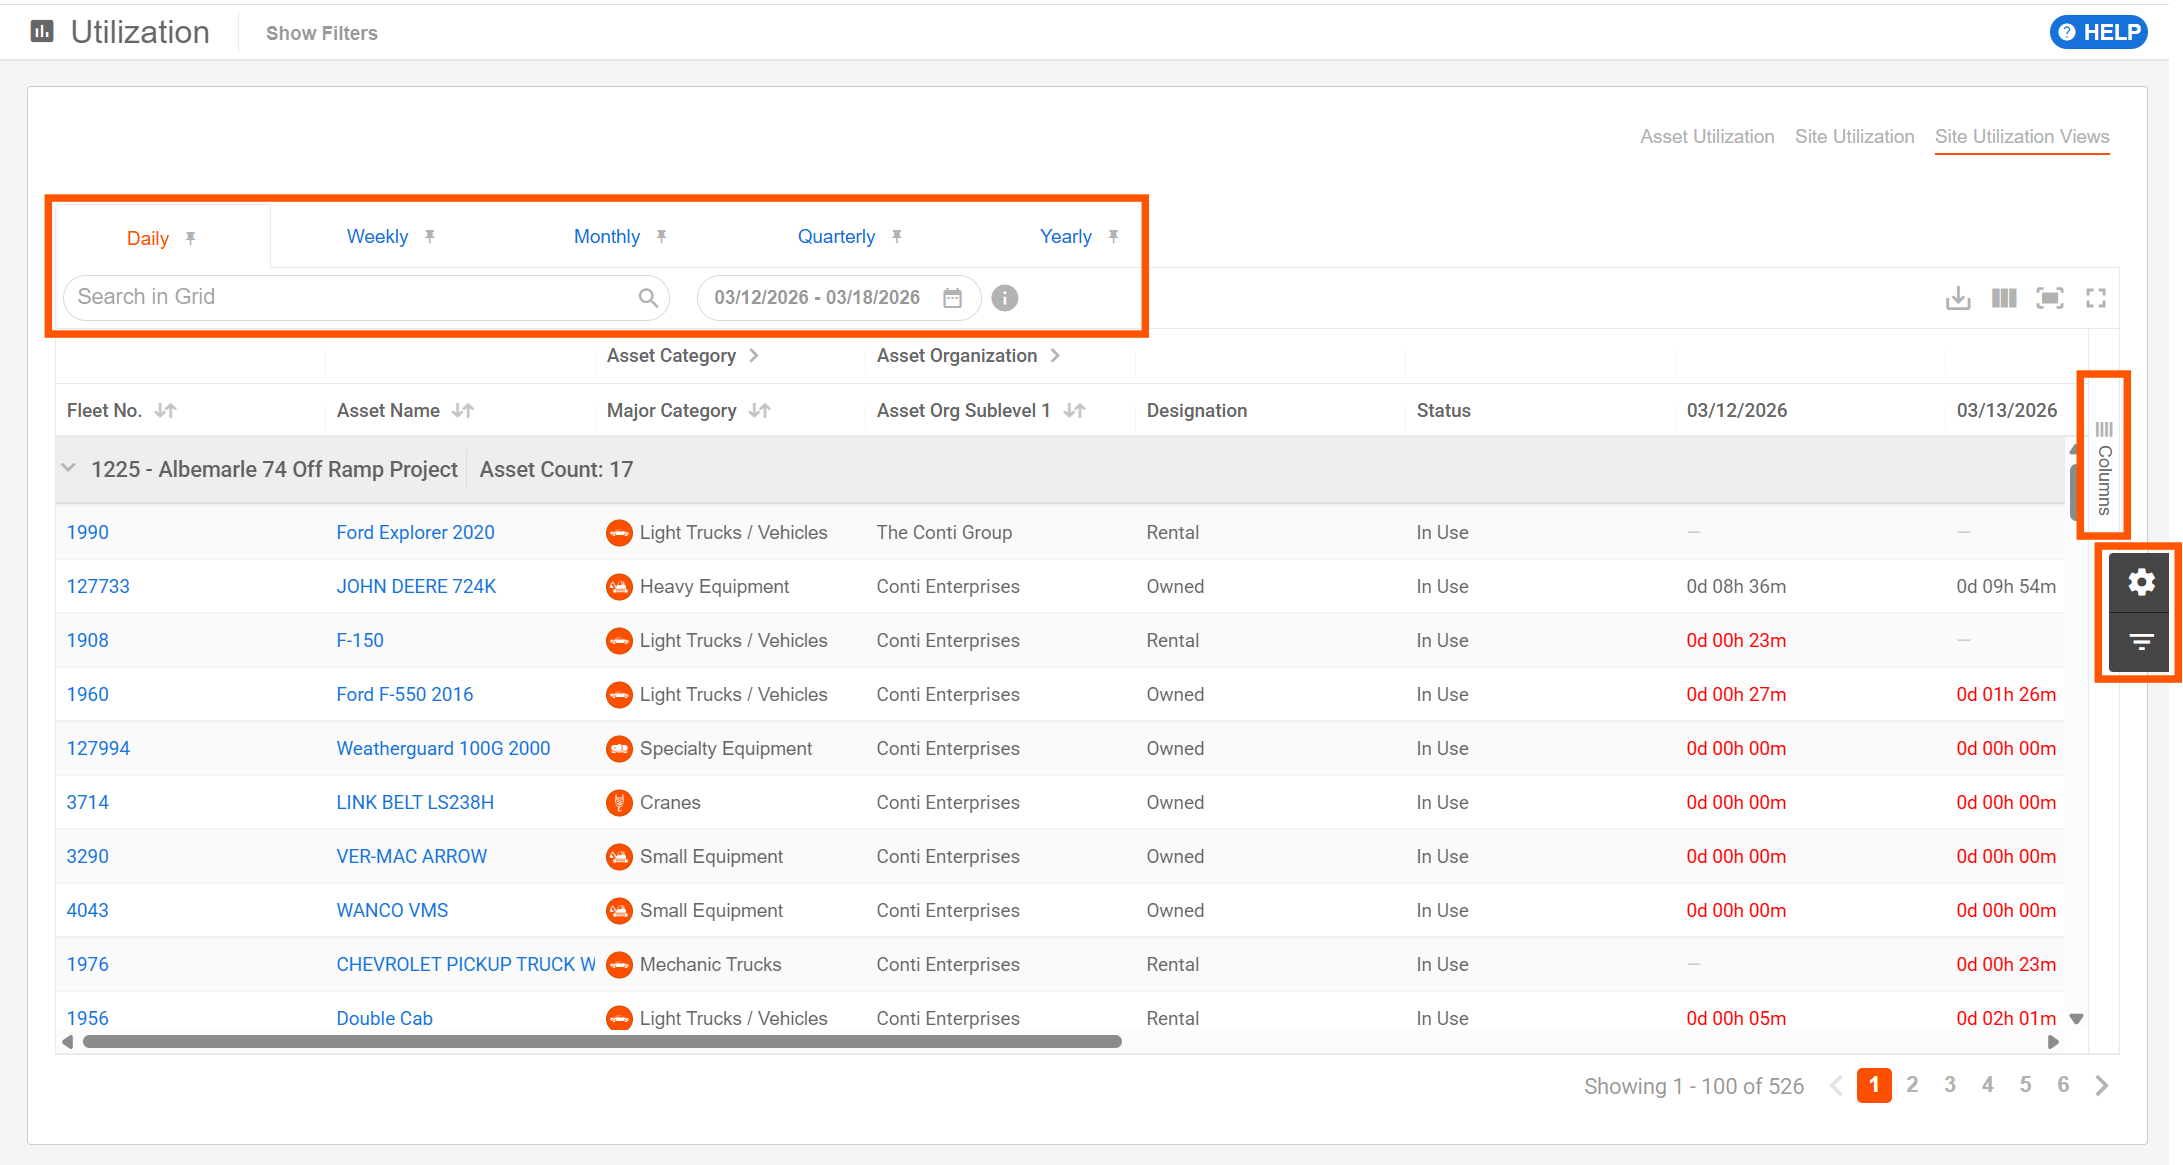
- Click on the tabs at the top to swap between Daily, Weekly, Monthly, Quarterly, and Yearly views.
Pro Tip! Click the pin icon to choose a default tab for your view.

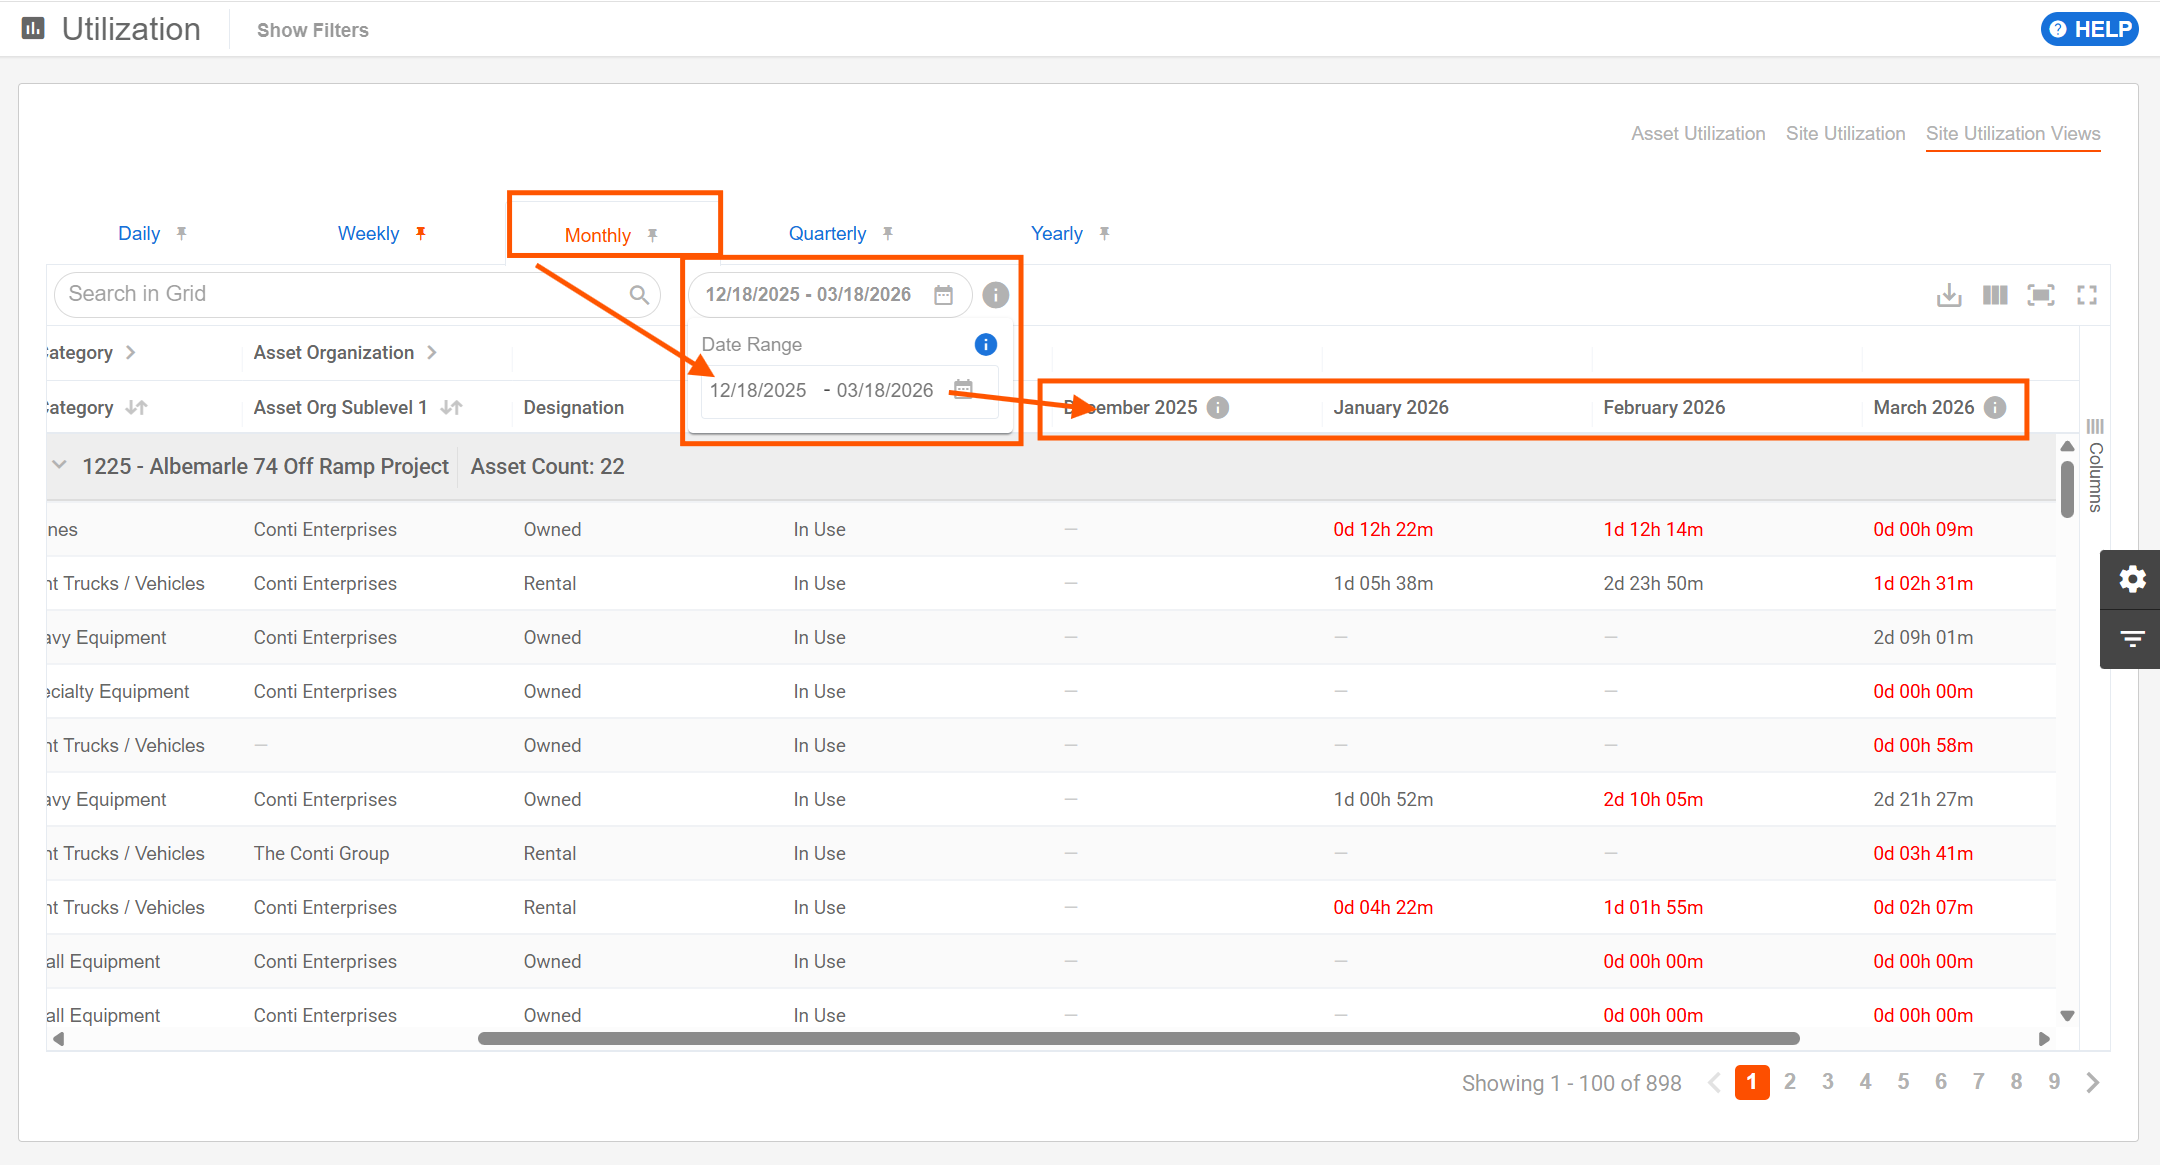
- Use the date range picker to select the start and end dates for the data you would like to see in the grid. The data columns will group accordingly depending on the tab you are viewing (daily, weekly, monthly, etc.).
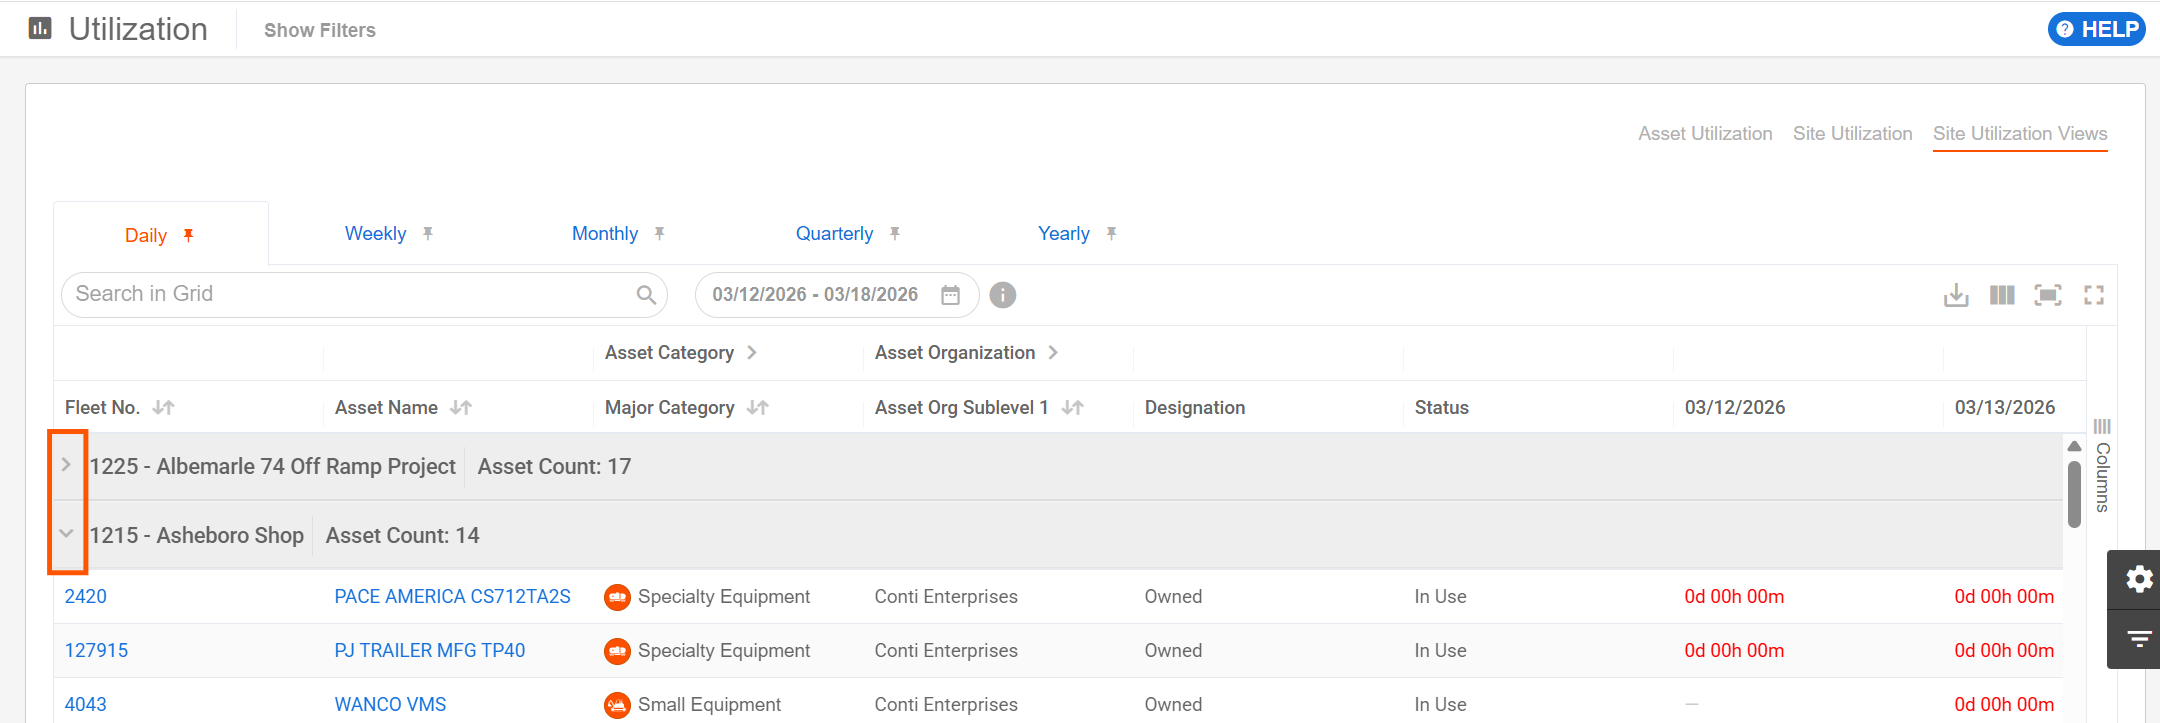
- Click the arrows to expand or collapse sites.
For more details on configuring and navigating Tenna reports, view How to Run, View, Filter, Sort, Save and Export Reports (Desktop).
In the example below, you can see that the Ford F-550 is being under-utilized on the site because all of the data is red. This means they are below the Low Utilization Threshold Mark configured in your account.
How to View Site Details Utilization
- 1
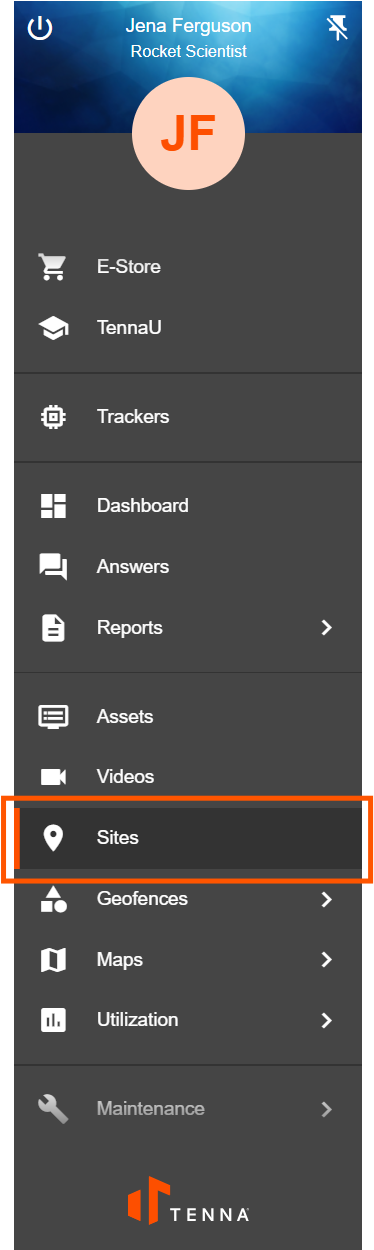
- Click "Sites" on the left side navigation.
- 2
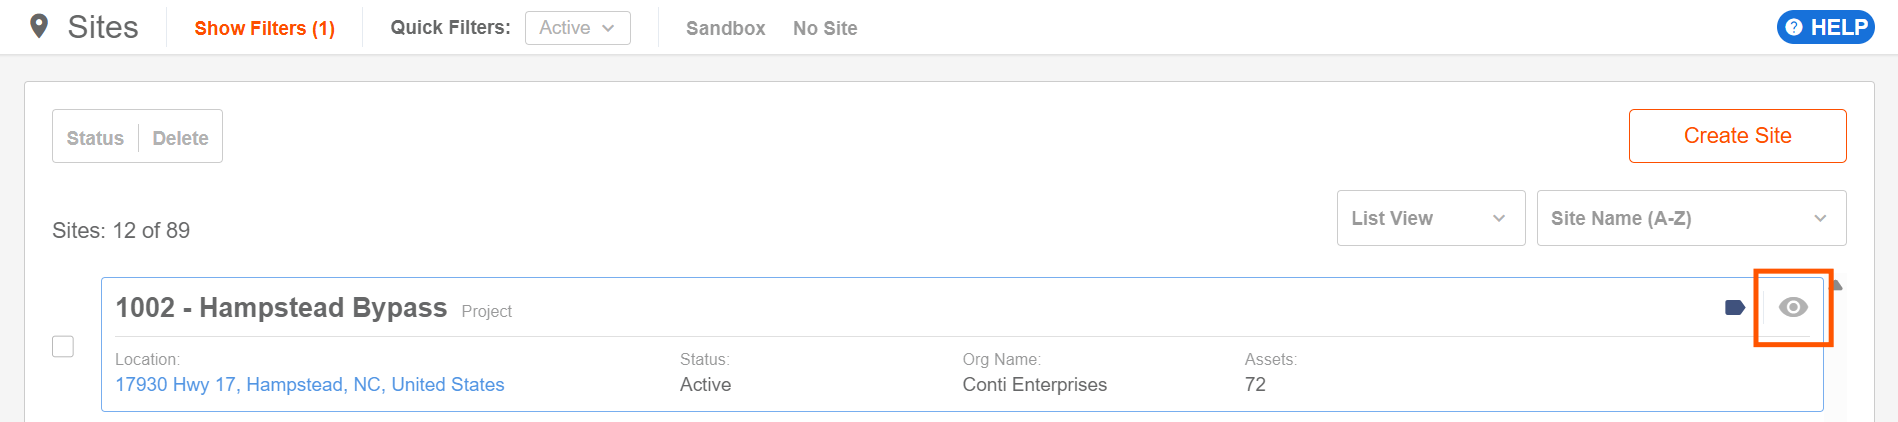
- Click on a Site to open the Site Details page.
- 3
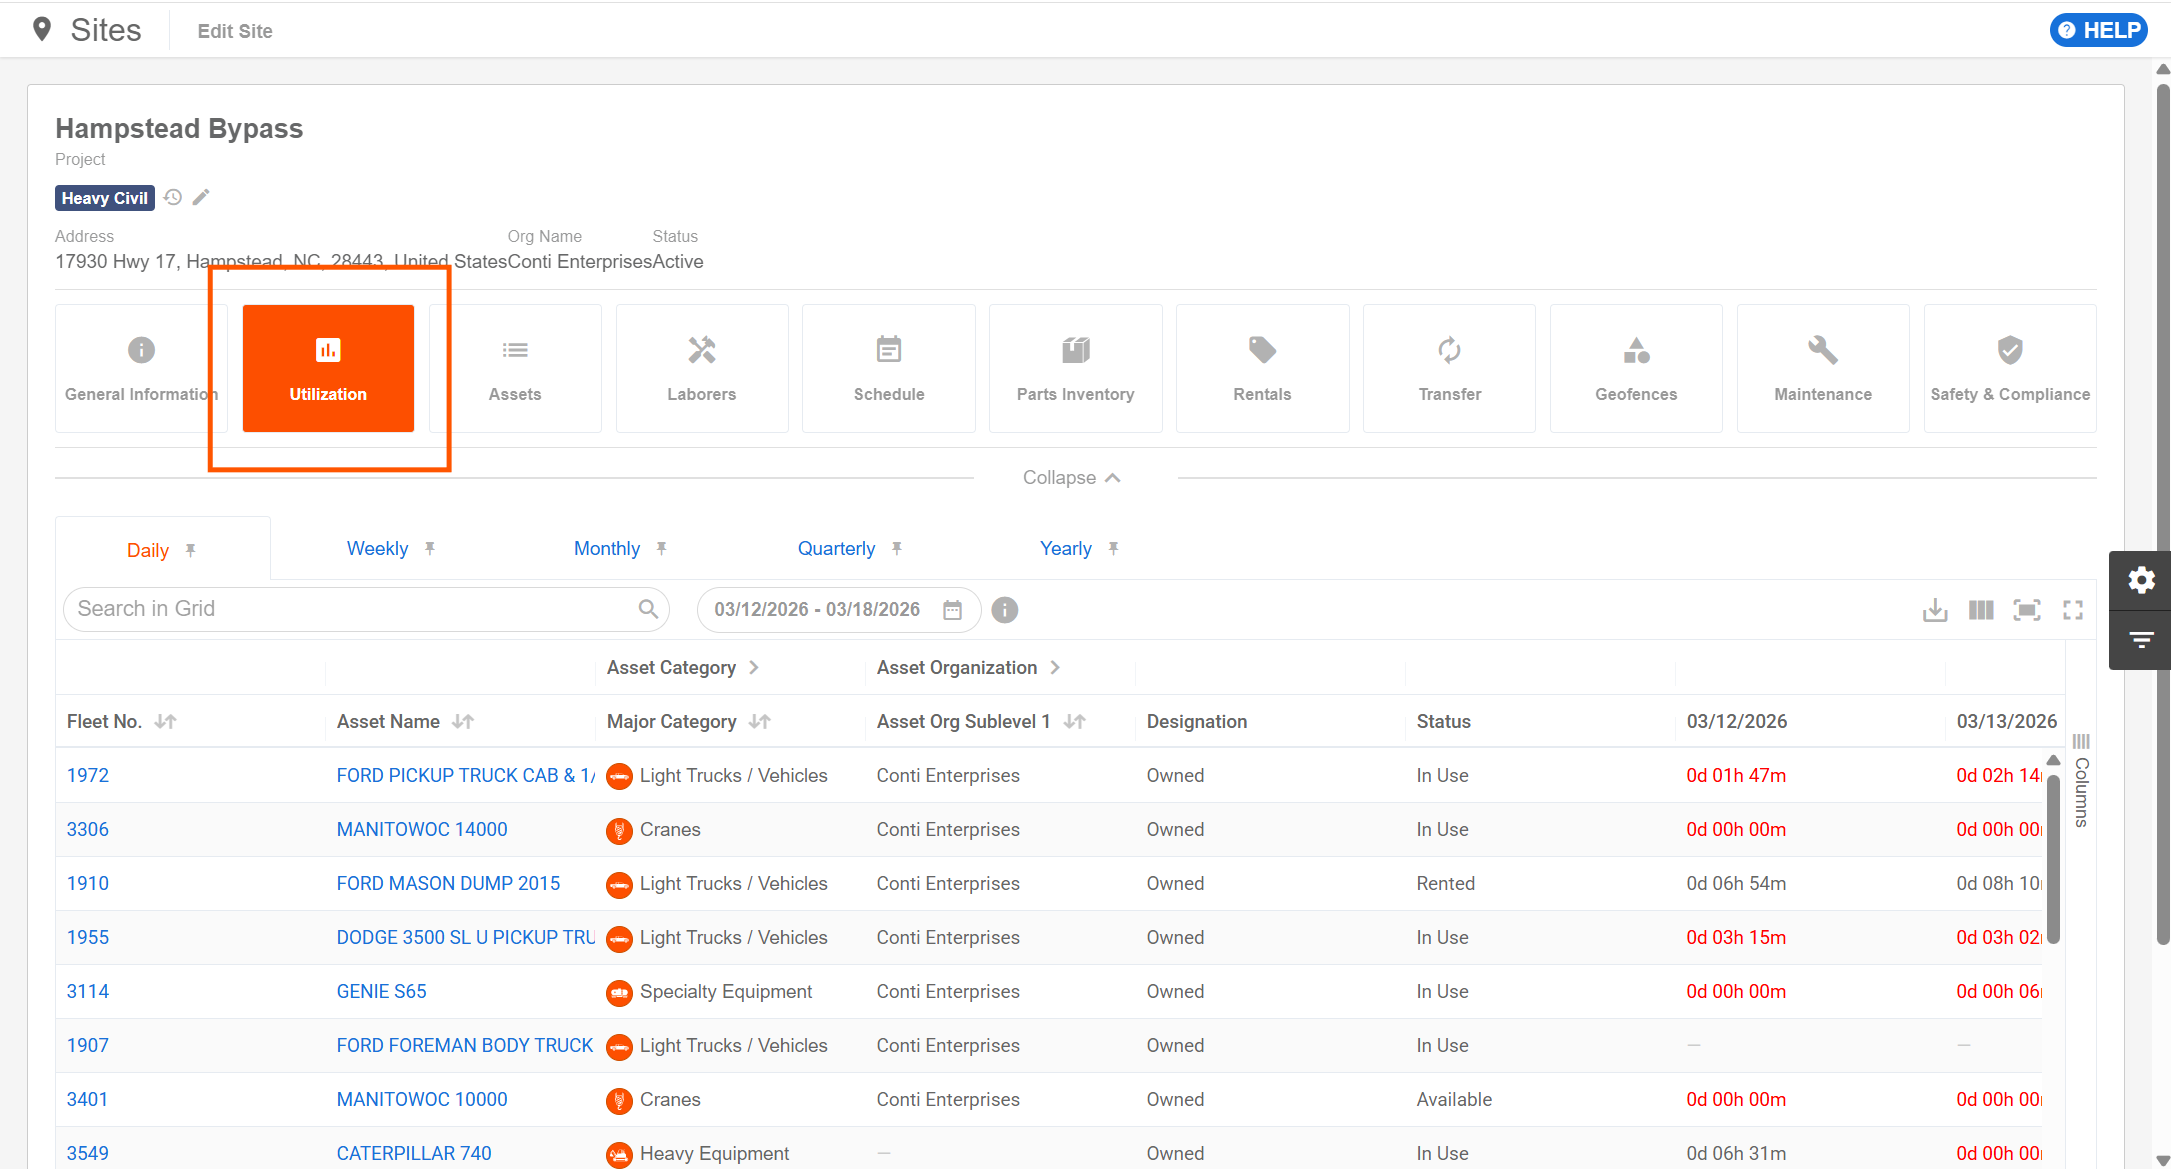
- Click the "Utilization" tab.
Note: The data and functionality in this grid are the same as the Site Utilization Views Report, except the Site Details Utilization grid is specific to the Site you are viewing. The grid below does not show data for other Sites in your account.
For more details on configuring and navigating Tenna reports, view How to Run, View, Filter, Sort, Save and Export Reports (Desktop).
How to View Site Utilization Grid
The Site Utilization grid is a summary level view that shows a list of all assets, similar to the "Asset Utilization" view, but grouped based on their current site.
- 1
- Click "Utilization" on the left side navigation.
- 2
- Select "Site Utilization".

- 3
- Utilize the search bar, settings, and filters to navigate the grid.
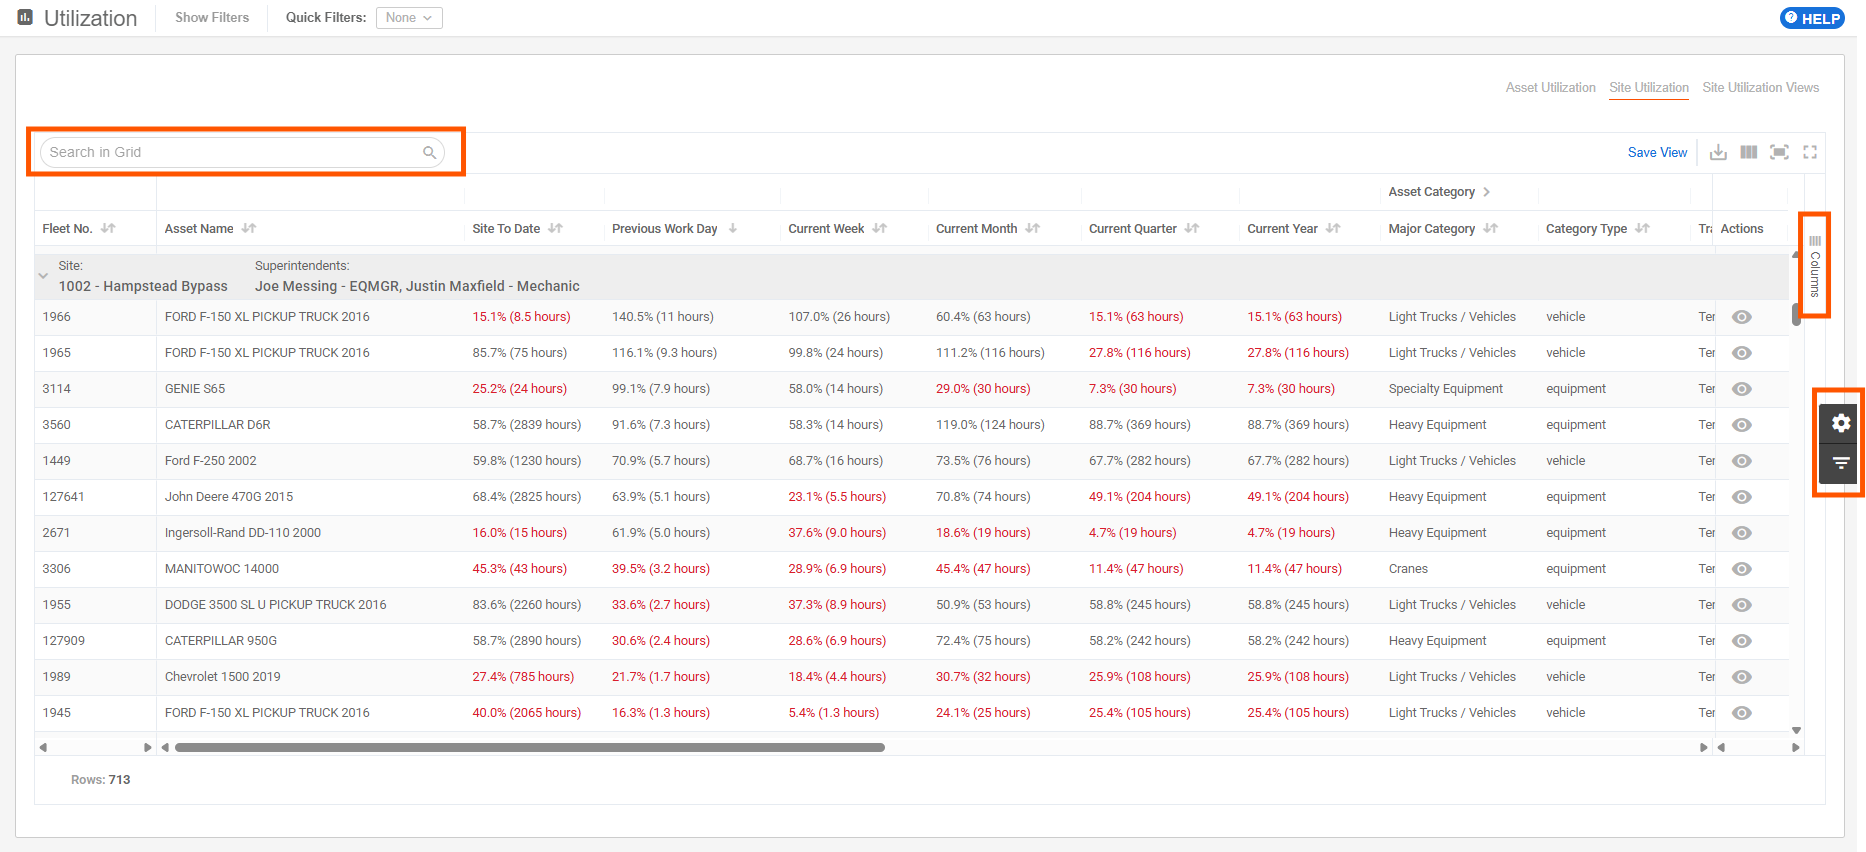
Note: Assets are grouped and displayed under the site they are currently associated with. The “Site to Date” value reflects the asset’s activity for that current site association. All other values are sourced from the asset utilization view.
For a more complete understanding of site utilization, especially for assets that move frequently between sites, use the Site Utilization Views report.
AEMP Assets
- 1
- Click the "gear" icon on the far right.

- 2
- Select the toggle to "Show AEMP Assets".
Important! If you have the Procore Integration, you must have this toggle selected in order to have site utilization information sent to Procore.

For more details on configuring and navigating Tenna reports, view How to Run, View, Filter, Sort, Save and Export Reports (Desktop).